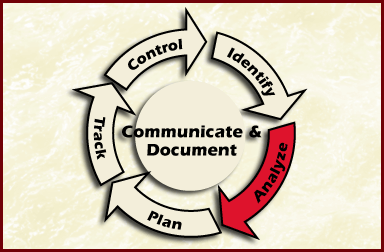

In this module you will study activities involved in the second phase of the risk management paradigm. You will learn and understand three analysis activities: Evaluate attributes of risk , Classify risks, and Prioritize (ranking) risks. The activities associated with filling in the risk information sheet.
Lets go back and visualize Roger L Van Scoy's paradigm [Van Scoy 92, p.9] and what he said. To refresh you memory, Van Scoy said:
"Risk analysis is the next element in the risk management paradigm. Risk analysis is the conversion of risk data into risk management information. Each risk must be understood sufficiently to allow a manager to make decisions. Risk analysis sifts the known risks, and places the information in the hands of the decision maker. Analysis provides the information that allows managers to work on the right risks."
The paradigm illustrates a set of functions that are identified as continuous activities throughout the life cycle of a project. The Analyze phase is highlighted in Figure Analyze Risk Management Paradigm.

Figure Analyze Risk Management Paradigm
The purpose of Analyze is to convert the Statement of risks and list of risks into decision-making information. Analysis is a process of examining the risks and context statements in detail to determine the extent of the risks, how the risks relate to each other independently or in a set, and which risks are the most important. Analyzing risks has three basic activities: evaluating the attributes of the risks (impact, probability, and timeframe), classifying the risks, and prioritizing or ranking the risks.
The Figure Analyze Process shows the inputs and outputs of the Analyze function.
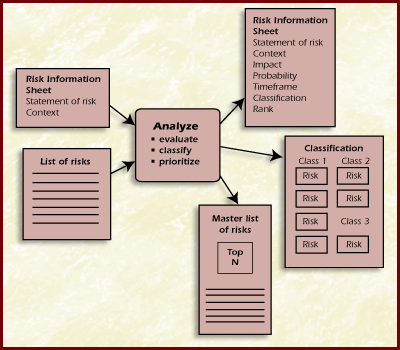
Figure Analyze Process
Inputs:
The following are the description of inputs and outputs to the analyze function. The list of risks contains all the statements of risk that need to be analyzed. Prior to analysis, the risk information sheet for each risk contains the statement of risk and its supporting context. After analysis, values for impact, probability, timeframe, class, and rank are added to the risk information sheet (statement of risk, supporting context) for each risk. Classification organizes risks into groups having some common basis. The organization may come from a predefined structure or from a self-organized structure. This list is an organization of the risks according to its classification. The master list of risks contains all risks that have been identified and the priority ranking of the top N risks.Since the Risk Information Sheet is a key configuration-tracking artifact, it will be described first. The Risk Information Sheet has been started in the Identify phase and contains the risk statement and its supporting context statement. During the analyze phase, the risk analyst adds to the risk information sheet for each risk values for impact, probability, timeframe, class, and rank. Figure Risk Information Sheet for Analyze is an example of the areas to be filled in on the risk information sheet for analyze.
|
ID |
Risk Information Sheet |
Identified: |
||||
|
Priority |
Statement: |
|||||
|
Probability |
||||||
|
Impact |
||||||
|
Timeframe |
Originator |
Class |
Assigned to |
|||
|
Context |
||||||
|
Approach: Research / Accept / Watch / Mitigate |
||||||
|
Contingency Plan and Trigger |
||||||
|
Status Status Date |
||||||
|
Approval |
Closing Date ___/___/___ |
Closing Rationale |
||||
Figure Risk Information Sheet for Analyze
The shaded areas indicate the five fields that the risk analyst fills out during Analyze phase of the paradigm.
The three Analyze activities (evaluate, classify and prioritize) will now be expanded upon.
The objective of evaluating the attributes is to gain a better understanding of the risk by determining the expected impact, probability, and timeframe of the risk. The Figure Evaluate shows the inputs and outputs for evaluating the attributes of risks
|
Figure Evaluate
|
Evaluating is the first step of the three steps in the analyze phase. Evaluating provides a better understanding of the risk by qualifying the expected impact, probability, and timeframe of a risk. Evaluating the attributes of a risk involves establishing the current values for:
Risks should be evaluated at a level of analysis that is sufficient to determine the relative importance, for planning cost-effective mitigation strategies, and to support tracking. Therefore, individual risks can be analyzed and managed at various levels of detail at different points in time.
As an example a high impact, high probability risk may require a more detailed level of analysis to plan a mitigation strategy. In contrast, simply knowing a risk is not likely to occur (low probability) and will have an insignificant impact (low impact) if it does occur maybe all the risk analyst needs to do is to decide how to deal with the risk.
Table Levels of Analysis lists some ranges of attribute values for a risk at various levels of analysis. It is representative of many possible levels. There is a wide range of levels possible between the binary level and the n-level. There could be four levels, ten levels, etc. It is also possible to have a combination of levels for attributes of a given risk.
Table Levels of Analysis
|
Level |
Impact |
Probability |
Timeframe |
|
Binary Level |
Significant Insignificant |
Likely Not likely |
Near Far |
|
Tri-level |
High Mod Low |
High Mod Low |
Near Mid Far |
|
Five-level |
Very High High Mod Low Very Low |
Very High High Mod Low Very Low |
Imminent Near Mid Far Very Far |
|
N-level |
N-Levels of Impact |
N-Levels of Probability |
N-Levels of Timeframes |
The Table Levels of Risk Exposure summarizes the various values of the risk exposure associated with the range of Levels of Analysis.
Table Levels of Risk Exposure
|
Level |
Risk Exposure |
|
Binary Level |
There are four (4) possible values of risk exposure (impact - probability).
|
|
Tri-level |
There are nine (9) possible values of risk exposure (impact probability).
|
|
Five-level |
There are twenty-five (25) possible values of risk exposure (impact probability).
|
|
N-Level |
There is a continuum of values for the risk exposure. The range of these values will depend on the maximum value used for the impact. |
Individual risks can be analyzed and managed at various levels of detail at different points in time. For example this is the first time the risk analysis team has identified the risks on a project and they came up with 100 risks. They could do a detailed analysis on all 100 risks but this would be very time consuming and many details might be lost in the effort. The team might perform a binary level analysis to quickly sort out the risks that could potentially be catastrophic or critical to the project. For some of the risks the team may want to do a more detailed analysis. Therefore, various levels of analysis could be used to filter a large number of risks into descending order levels. The purpose is to show that risks should be evaluated at a level of analysis that is sufficient:
The attribute values for each risk are determined based on specific criteria. The results will be more useful if the project team defines the criteria for the attribute values that make sense to the project. These need to be defined in the Risk Management Plan. One person's critical could be another person's marginal. The definitions need to be set by the project team at the beginning of the project and maintained throughout the life cycle. The more specific the criteria, the easier it will be for risk team participants to evaluate the risks. Vague criteria are open to interpretation. Project risk team personnel should apply the criteria consistently.
The Table Air Force Summary shows the AFSC/AFLC Pamphlet 800-45 [Air Force 88, p. 153] example of risk exposure.
Table Air Force Summary
|
Impact |
Frequency |
Probability |
Improbable |
Improbable |
|
Catastrophic |
High |
High |
Mod |
None |
|
Critical |
High |
Mod |
Mod |
None |
|
Marginal |
Mod |
Mod |
Low |
None |
|
Negligible |
Mod |
Low |
Low |
None |
The risk team should be aware of performing multiplication on the ordinal scale values, if the impact and probability have been evaluated qualitatively using ordinal numbers. The individual scale values provide information on the impact and probability of the risk. Multiplying these ordinal values to obtain risk exposure provides information that if not careful thought out could be misinterpreted.
The following Table Risk Exposure and Ordinal Numbers shows ordinal values applied to the Air Force impact and probability values as example as well as the combined values for risk exposure. Consider a risk, X, which is evaluated as critical (3) and frequent (4). This risk has a high-risk exposure, which is calculated as the product of impact and probability, which is 12. Consider a second risk, Y, which is evaluated as critical (3) and improbable (2). The risk exposure for Y is 6, a moderate risk exposure. With ordinal numbers all one can say is that risk X has a higher risk exposure than risk Y. It is tempting to say that risk X has twice the risk exposure than risk Y. With ordinal numbers one cannot say how much higher the risk exposure for risk X is than risk Y. The danger comes when one applys more meaning to numbers than the numbers support.
Table Risk Exposure and Ordinal Numbers
|
Impact (ordinal) |
Frequency (4) |
Probability (3) |
Improbable (2) |
Impossible (1) |
|
Catastrophic (4) |
High (16) |
High (12) |
Mod (8) |
None (4) |
|
Critical (3) |
High (12) |
Mod (9) |
Mod (6) |
None (3) |
|
Martginal (2) |
Mod (8) |
Mod (6) |
Low (4) |
None (2) |
|
Negligible (1) |
Mod (4) |
Low (3) |
Low (2) |
None (1) |
Another example shown in Table NASA Safety Impact Definitions are the definitions used by safety analysts/engineers at NASA
Table NASA Safety Impact Definitions
|
Impact |
Definition |
|
Catastrophic |
Loss of human life Permanent human disability |
|
Critical |
Major system damage Severe injury Temporary disability |
|
Marginal |
Minor system damage Minor injury (e.g., scratch) |
|
Negligible |
No system damage No injury (possibly some aggravation) |
These terms are used by safety analysts/engineers at NASA to help categorize potential hazardous risks. When determining if a particular risk has safety implications, it is best to use what the safety analyst looks at to determine safety risk. The risk team should work with a safety analyst/engineer and report any risks that have the potential for injury or mission damage. In the safety engineering area, any possibility that a catastrophic or critical failure may occur is deemed worthy of writing a hazard report about. That hazard report may explain why it is highly unlikely for that particular event to occur and will document what safeguards are in place to prevent the occurrence of such an event. It is still a hazard even if it is remotely likely to occur and several safeguards are in place.
An example with quantifiable numbers associated with the impact is shown in Table Quantifiable Impact Definitions.
Table Quantifiable Impact Definitions
|
Catastrophic |
Critical |
Marginal |
|
|
Schedule Slip |
> 20% |
10% - 20% |
0% -10% |
|
Cost overrun |
> 15% |
5% - 15% |
0% - 5% |
|
Technical |
System is lost |
Major function lost |
Data lost |
Again remember that the risk manager/project manager must do the definitions at the beginning of the project and the definitions must be included in the risk management plan. If the impact is negligible then it may not be necessary to carry the activity as a risk, but the risk identified must first be evaluated to determine its importance to the project.
The Timeframe is the time when action to mitigate a risk must be taken. This attribute is added to the Risk Information Sheet. The following are examples of term and quantifiable values that could be used. These relevant time values are use to fill in the example project timeframes used for IR-SIP.
Example Timeframe Definitions:
The three key words are near, mid, and far term with the associated number of suggested days. The days are flexible depending on the size of the project.
The Probability definition is the likelihood that the risk will occur. This attribute is added to the Risk Information Sheet. Each project team will have to define and agree on the ranges as applicable for there levels of risk.
The following are example Probability Definitions:
Interactive Tri-Level Attribute Evaluation TBD xxxx
Consider the purpose of the evaluation effort. The time and resources required for the evaluation must be balanced against the value of the added level of information. For example, initially the team may choose a binary level of analysis to sort through a large number of risks. Then the team may decide that for a few of the more important risks they would like to revisit the evaluation with a more refined measure of the attributes. Choosing a level of analysis depends on a number of factors, such as:
Classify is the second step in the Analyze phase.There are several ways to classify or group risks. The ultimate purpose of classification is to understand the nature of the risks facing the project and to group any related risks in order to build more cost-effective mitigation plans. The process of classifying risks may reveal that two or more risks are equivalent. The statements of risk and context statement indicate that the subject of these risks is the same. Equivalent risks are therefore duplicate statements of the same risk and should be combined into one risk or a set of risks. Classifying risks involves grouping risks based on shared characteristics. The groups or classes show relationships among the risks. Classification helps to identify duplicate risks and supports simplifying the list of risks. The objective of classifying risks is to look at a set of risks and how those risks relate to each other within a given structure. The classes or groups of risks provide a different perspective when planning risks.
The Diagram Classify shows the inputs and outputs for classifying risks.
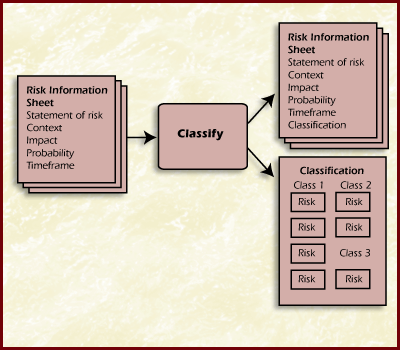
Diagram Classify
Within the Continuous Risk Management approach, risks are classified using two conceptual perspectives as listed in the Table Classification Perspectives.
Table Classification Perspectives
|
Classification Perspective |
Description |
|
Predefined structure |
Places risks into a predefined structure by applying the selected criterion to the statement of risk and context Example: software development risk taxonomy [Carr 93], work breakdown structure |
|
Self-organized structure |
Organizes risks into distinct categories based on common characteristics; the structure and criteria emerge as a result of the classification process. Like affinity grouping. |
Two criteria for grouping risks are by classifying by source or impact. When classifying risks using the predefined structure, the criterion chosen will affect the outcome of groups of risks. The two criteria for grouping risks are:
Classification by impact can occur at several levels. Risks may be classified by their impact on technical work, budget, or schedule. This high level classification can show a manager, which risks the customer may see and which risks are primarily internal to the project. A useful classification for planning might look at a more detailed view of where the impact will be felt such as a product subsystem.
There are several classification uses or ways to classify or group risks. The ultimate purpose of classification is to understand the risks the project faces and group related risks to help build more cost-effective mitigation plans. Multiple views may provide insight into how best to deal with the risks in planning. It is important to maintain the classification structure during planning. The classification is not helpful if it is not used consistently in planning. If the structure is changed, the risk teak should reclassify all the risks. Some examples the team could use to classify are:
Cost Organizational
Technical Political
Safety Supportability
The first time project members identify risks; they may come up with a large number. This is called multiple classifications. Initially, they may classify according-to the source of risk to understand the global risk picture. For example which risks are resulting from requirements instability? However, mitigating the risks may best be done by a different classification based on the group or person assigned to deal with the risk or what other risks affect the same area. The computer engineer would be assigned the risks that are affecting the compiler performance. Both views provide valuable information to the project.
There are no specific rules for selecting a classification scheme. The project team should consider what would help during the planning process. The team should use a database to store, sort, and merge multiple classification information to make it manageable.
The result of a classification may be shown as a Bar Graph in Figure Classification Bar Graph. A classification bar graph is a graphic display of the groups in a classification and the number of risks in each group.
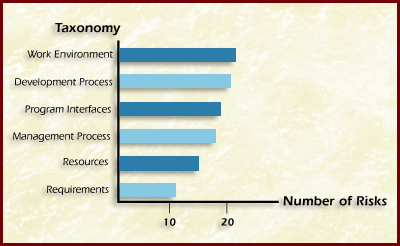
Figure Classification Bar Graph
The bar graph indicates the number of risks that were classified, based on the source of the risk, into each taxonomy element of the software development risk taxonomy class/element/attribute structure [Carr 93].
Duplicate risks should be combined or put into sets of risks. The process of classifying risks may reveal that two or more risks have equivalent risk and context statements. This will indicate that the subject of these risks is the same. Equivalent risks are therefore duplicate statements of the same risk and should be combined into one risk.
When the team merges some classes into sets they should write a new summary risk statement that consolidates all the risks into one. Then assign the summary risk statement a new ID number. The individual risk statements (and their original ID numbers) become part of the context statement, and the entire context from each risk is merged. The project doesn't want to lose captured risk information. The attribute evaluation information for impact, probability, and timeframe should reflect the worst case of the individual risks.
Table Consolidating Risk shows that three risks ID 1, 16 and 17 are very similar and can be merged into a new summary risk statement and given a new ID 101. A numbering scheme for the summary risk statement should be developed that works for the project and new number should differentiate consolidated risks. In the example a 3-digit number (ID 101) is used.
Table Consolidating Risk
|
Probability |
Impact |
Timeframe |
||
|
1 |
This is the first time that the software staff will use OOD; the staff may have a lower than expected productivity rate and schedules may slip because of the associated learning curve. |
High |
Mod |
Near |
|
16 |
The C++ compiler selected for use does not come with very good user documentation, as supplied by the vendor; decreased productivity likely as software developers stumble over the same problems. |
Mod |
Mod |
Mid |
|
17 |
This is the first time that software staff has used C++; staff may have lower than expected productivity rate, schedule may slip. |
Mod |
Mod |
Mid |
|
New summary risk statement |
||||
|
101 |
Use of C++, the selected compiler, and OOD are new for software staff; decreased productivity due to unexpected learning curves may cause coding schedule to slip. |
High |
Mod |
N |
Table Methods and Tools summarize the methods and tools for classifying risks.
Table Methods and Tools
|
Method or Tool |
Description |
|
Affinity Grouping |
Groups risks that are naturally related and then identifies the one concept that ties each grouping together [Brassard 89] |
|
Bar Graph |
Presents a graphical summary of the number of risks in each classification category |
|
Risk Form |
Used to capture the results of the affinity grouping or taxonomy classification method for a risk. |
|
Risk Information Sheet |
Used to document the classification results of the affinity grouping or taxonomy classification methods for a risk |
|
Taxonomy Classification |
Groups risks according to software development areas using the software development risk taxonomy's class/element/attribute structure. |
The third and final step in the Analysis phase, is the risk team's activity of prioritizing (ranking) the risks. The purpose is to sort through a large number of risks and determine which are most important and to separate out which risks should be dealt with first when allocating resources. This involves partitioning risks or groups of risks based on the "vital few" sense and ranking risks or sets of risks based on consistently applying an established set of criteria. No project has unlimited resources with which to mitigate risks. Thus, it is essential to determine consistently and efficiently which risks are most important and then to focus those limited resources on mitigating risks. Figure Prioritize shows the inputs and outputs for prioritizing risks.
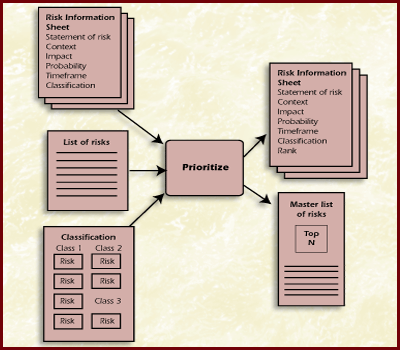
Figure Prioritize
Conditions and priorities will change during a project, and this natural evolution can affect the important risks to a project. Risk analysis must be a continuous process throughout the project life cycle. Analysis requires open communication so that prioritization and evaluation is accomplished using all known information. A forward-looking view enables risk team personnel to consider the long-range impacts of risks. Prioritizing (ranking) risks involves partitioning risks or groups of risks based on the Pareto (Pa-ray'-to) "vital few" sense [Juran 89] and ranking the risks or sets of risks based upon a criterion or set of criteria as appropriate. The risks team will be spending most of their time and effort on. The vital few or 80/20 rule for risk means that the team will spend 80% of their resources on the top 20% of the risks.
Vilfredo Pareto (1848-1923) was an Italian economist and sociologist who posited that 80% of the world's wealth and power resided with 20% of the population and that, if the wealth and power were evenly distributed over the entire population, 80% of the wealth and power would eventually return to the hands of the 20%.
Sets of risks may be prioritized along with singular risk statements because a project's risks are dealt with at various levels of complexity. One singular risk statement may warrant being dealt with by itself due to the nature of the risk, while another may best be dealt with by grouping them with other risks that are related. In other words, sometimes a risk is only seen when all the component pieces (i.e., smaller, related risks) are put together. It is not uncommon to deal with both single risks and sets of risks at the same time. The objective of prioritizing risks is to separate out which risks should be dealt with first (the vital few risks) when allocating resources.
Ranking the top N risks or groups of risks involves taking the list of top N risks and ordering these based upon a criterion or set of criteria into a rank ordered list. Selecting the "N" risks involves using the attribute (impact, probability, and timeframe) values that were evaluated. The Pareto Top N risks are the risks that will be prioritized based on the criteria selected for the project as well as the attributes of impact, probability, and timeframe. Remember that risk attributes are good guidelines, but are not an exact science. The list of risks contains single risks as well as sets of risks. The Diagram Top N Risks shows a top N list made up of single risks and sets of risks.
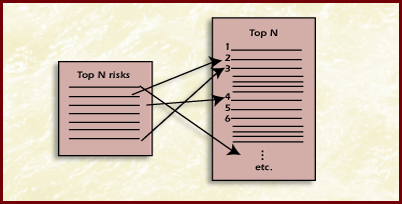
Diagram Top N Risks
The Table Pareto Top 20% is an example of the Pareto Top 20% using the risks in the IR-SIP.
Table Pareto Top 20%
|
Rank |
ID |
Risk Statement |
Probability |
Impact |
Timeframe |
|
10% |
2 |
Commercial parts are being selected for space flight applications and their suitability to meet environmental conditions is unknown; these parts may fail to operate on-orbit within the environment window, leading to system level failures. Also, environmental testing of these parts can be expensive and cause schedule delays. |
High |
High |
Mid |
|
10% |
5 |
Lack of a thorough hardware test program; mission failure due to environmental conditions not tested. |
High |
High |
Far |
|
10% |
100 |
Project resources (personnel number and availability) and schedules were underestimated; schedule slips, cost overruns, reduction in adequacy of development processes (especially testing time adequacy) likely. |
High |
High |
Near |
|
20% |
101 |
Use of C++, the selected compiler, and OOD are new for software staff; decreased productivity due to unexpected learning curves may cause coding schedule to slip. |
High |
Mod |
Near |
|
20% |
10 |
Yearly congressional NASA budget profiles are subject to change; this may cause the project funding profile to change each year with associated replanning, schedule impacts, labor cost increases, loss of key personnel, or project termination. |
High |
Mod |
Far |
|
20% |
4 |
First time the IR Instrument Project manager is managing a project to go into space; Project may fail due to insufficient / poor management. |
Mod |
High |
Near |
|
26% |
7 |
Science requirements have substantial TBDs; late completion of TBDs likely, with reduction in adequate testing time, possible science application software failure, incorrect science data being captured, hardware damage if incorrect safety limits were provided, extensive rework and substantial cost overruns, mission failure if problems not found before system is in operation. |
Mod |
High |
Mid |
The risks are sorted from highest to lowest based on the values for probability, impact, and timeframe that were the result of the Tri-Level Attribute Evaluation method. For the IR-SIP project, a total of 30 risks were identified (note: not all risks are shown). The 10% and 20% break points are indicated. At the 10% break point, not all of the high-risk exposure risks are included. The 20% break point hits after the high-risk exposure values. In the IR-SIP Project Manager Jerry Johnstone decided to draw the line at moderate risk exposure with near-term timeframe but has special concerns about risk ID 7 and he therefore decides to draw the line at 26% and include risk ID 7. The criteria may change over the life of the project. Prioritization of risks will also change over the life of the project. As time progresses risks will emerge, change, and go away. Risks will be reprioritized as part of continuously managing risks on the project.
The Potential Top N is another method that selects the most important risks to a project base on the individual knowledge of the participants in the project. The potential top N is generated by sequentially selecting risks from each individual top 5 lists in rounds until all risks are selected. The result is a non-ordered list of important risks to the project. When the method is being used during the Analyze activity or any other group activity, a individual top 5 lists per each participant.
The criterion or set of criteria used to rank the risks is chosen based on what's most important to the project. For example:
The Potential Top N selection process is shown in the Figure Potential Top N Selection.
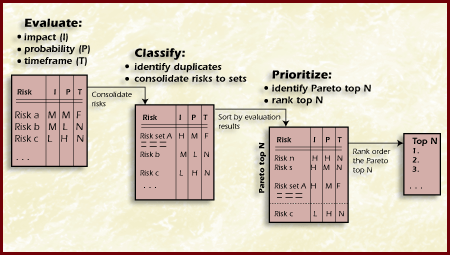
Figure Top N Selection
While the project-wide Pareto "vital few" can be managed at the highest levels, all of the other risks can be managed within the departments or teams of the organization most suited to effectively manage those risks. In the Plan phase these risks will be delegated to the appropriate level of management.
The Multivoting method is a general voting method. It can be used to conduct a straw poll or select the most important items from a list with limited discussion and limited difficulty. For a large number of items, a series of votes is used to reduce the list to a workable number. Each participant in the process votes on the items in the list.
The method is to selecting the number of votes to be used depends on the number of items on the list. A general rule of thumb is to allow evaluators votes to be equal to one-third the number of items on the list. The Figure Multivoting is an example of a tally form used to combine all evaluators' votes. There are 5 evaluators; there are a total of 12 risks (labeled A - H) so each participant gets 3 (or 4) weighted votes. This example used 3 votes. Selecting the voting criteria depends on the project objectives and constraints. The evaluators must decide what criteria are appropriate to use for ranking based on what's important to the project. Some examples are:
After everyone votes, the totals for each risk are tallied, thus in this example, ranking the risks with H the highest B next then A C J. The other risks did not get any votes.
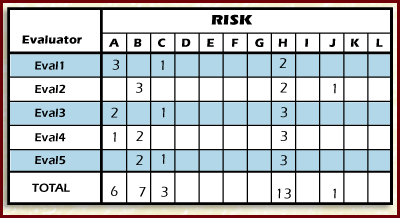
The Figure Multivoting
The following is an exercise for you to perform using the partial list of 10 risks given below. These risks were the ones selected using the Pareto Top 20% method. Identify those risks you feel are the three most critical to the project based on the prioritization criteria:
Vote for the three risks that are most important to the project based on the prioritization criteria. Give the most important risk 3 points, the next most important risk 2 points, and give the third most important risk 1 point.
Table List of 10 Risks
|
Risk ID |
Risk Statement |
Points |
|
2 |
Commercial parts are being selected for space flight applications and their suitability to meet environmental conditions is unknown; these parts may fail to operate on-orbit within the environment window, leading to system level failures. Also, environmental testing of these parts can be expensive and cause schedule delays. |
|
|
5 |
Lack of a thorough hardware test program; mission failure due to environmental conditions not tested. |
|
|
100 |
Project resources (personnel number and availability) and schedules were underestimated; schedule slips, cost overruns, reduction in adequacy of development processes (especially testing time adequacy) likely. |
|
|
101 |
Use of C++, the selected compiler, and OOD are new for software staff; decreased productivity due to unexpected learning curves may cause coding schedule to slip. |
|
|
10 |
Yearly congressional NASA budget profiles are subject to change; this may cause the project funding profile to change each year with associated replanning, schedule impacts, labor cost increases, loss of key personnel, or project termination. |
|
|
4 |
First time the IR Instrument Project manager is managing a project to go into space; Project may fail due to insufficient / poor management. |
|
|
7 |
Science requirements have substantial TBDs; late completion of TBDs likely, with reduction in adequate testing time, possible science application software failure, incorrect science data being captured, hardware damage if incorrect safety limits were provided, extensive rework and substantial cost overruns, mission failure if problems not found before system is in operation. |
|
|
14 |
Contracting a different test facility for acoustical testing; parts may be insufficiently tested or parts may be damaged with excessive testing. |
|
|
18 |
There is no AA Satellite Simulator currently scheduled for development; probable that the IR-SIP CSCI will fail when initially integrated with the actual AA Satellite since prior interface testing will not have been possible, thus fixes will be done very late in the project schedule and may cause the launch date to slip. |
|
|
20 |
Subset of IR Post Processing CSCI requirements is to be satisfied with COTS products; Integration time and lifecycle costs may increase from original estimates which assumed significant saving from COTS use, leading to schedule slips and cost overruns. |
Comparison risk ranking (CRR) is the last method examined in which risks are ranked by comparing the risks, two at a time, to an established criterion or set of criteria (stated in the form of a question). Each risk is compared to every other risk. Each participant in the process casts a vote in each comparison. An individual or a group can do comparison risk ranking. If performed by a group of three or more, one person should be the facilitator and recorder (but he or she could still participate or contribute).
In you opinion as a risk evaluator which risk (ID 2 or 5) is more important and may cause the project t
(ID 2) Commercial parts are being selected for space flight applications and their suitability to meet environmental conditions is unknown; these parts may fail to operate on-orbit within the environment window, leading to system level failures. Also, environmental testing of these parts can be expensive and cause schedule delays.
OR
(ID 5) Lack of a thorough hardware test program; mission failure due to environmental conditions not tested.
The Comparison Risk Ranking method compares two risks at a time with respect to the project criteria. There is an explicit comparison of every risk with every other risk and time for the participants to discuss each comparison and share their knowledge with each other prior to voting. The purpose of the discussion is to point out that prioritizing risks also provides an opportunity for communication within the project. Even with defined criteria, individuals will have their own background information that will affect how they prioritize. Multivoting is a good way to conduct a straw poll and see where individuals' initial rankings are. It's a good way to reduce a large list. Comparison Risk Ranking is an excellent way for project members to share information about risk during the prioritization process for a small number of risks.
The Table Prioritization Methods and Tools summarize the methods and tools for prioritizing risks.
Table Prioritization Methods and Tools
|
Methods and Tools |
Description |
|
Comparison risk ranking |
Risks are ranked by comparing them to an established criterion or set of criteria two at a time. |
|
Multivoting |
Individual votes are distributed across the risks, with the option to weigh the votes. Risks are ordered by tallying the individual votes. |
|
Pareto Top N |
The most important risks to the project are selected based on the tri-level attribute evaluation results. |
|
Potential Top N |
The most important risks to the project are selected based on individual options. |
|
Risk Information Sheet |
This sheet can be used to document the priority of a risk. |
|
Top 5 |
Risk team members choose the top 5 risks to the project. |
In summary no project has unlimited resources to mitigate risks. The risk team must determine what risks are most important and focus their resources on mitigating those risks.
The way the team determines the top N risks are:
[Air Force 88] Air Force Systems Command/Air Force Logistics Command Pamphlet 800-45. Software Risk Abatement, September 30, 1988.
[Boehm 89] Boehm, Barry. IEEE Tutorial on Software Risk Management. New. York: IEEE Computer Society Press, 1989.
[Brassard 89] Brassard, Michael. The Memory Jogger Plus: featuring the seven management and planning tools. Methuen, Ma.: GOAL/QPC, 1989.
[Carr-93] Carr, Marvin;.Konda, Suresh; Monarch, Ira; Ulrich, Carol; & Walker, Clay. Taxonomy -Based Risk Identification (CMU/SEI-93-TR-6, ADA266992). Pittsburgh, Pa.: Software Engineering Institute, Carnegie Mellon University, 1993.
[Juran 89] Juran, J. M. Juran on Leadership for Quality. New York: The Free Press, 1989.