Introduction
The risk based approach to testing is explained in six sections:
Risk Analysis Fundamentals: Chapter 2 contains a brief introduction to risk analysis in general with particular focus on using risk analysis to improve the software test process.
Metrics: Chapter 3 gives a basic introduction to the metrics recorded as part of the case study contained in this document.
The Case: Chapter 4 is the first chapter of the case study. It explains the background of how the methodology was implemented in one particular project
The Challenge: Chapters 5 and 6 further summarise what had to be done in the case project, why it should be done and how it should be done.
The Risk Analysis: Chapter 7 explains how the probability and cost of a fault was identified. Further, it discuss how the risk exposure of a given function was calculated to identify the most important functions and used as an input into the test process.
The Process and Organisation: Chapter 8 goes through the test process and discusses improvements made to the organisation and processes to support the risk based approach to testing in the case project.
In addition, chapter 9 briefly discusses the importance of automated testing as part of a risk based approach. Some areas for further research and of general interest are listed in chapter 10.
Risk Analysis fundamentals in software testing
This chapter provides a high level overview of risk analysis fundamentals and is only intended to be a basic introduction to the topic. Each of the activities described in this chapter are expanded upon as part of the included case study.
According to Webster’s New World Dictionary, risk is “the chance of injury, damage or loss; dangerous chance; hazard”.
The objective of Risk Analysis is to identify potential problems that could affect the cost or outcome of the project.
The objective of risk assessment is to take control over the potential problems before the problems control you, and remember: “prevention is always better than the cure”.
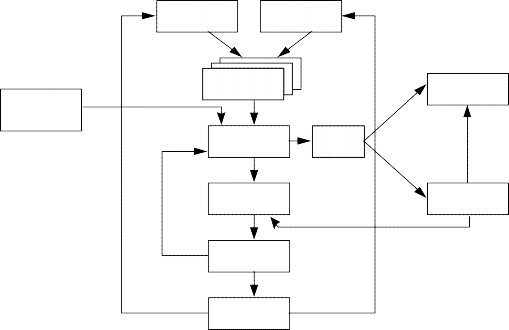
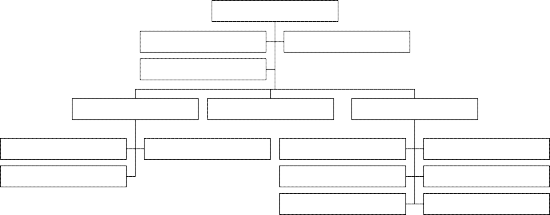
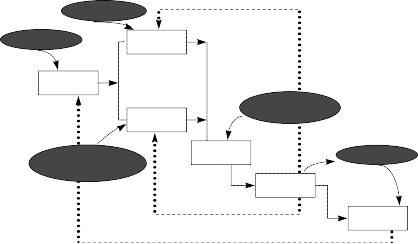
The following figure shows the activities involved in risk analysis. Each activity will be further discussed below.
Test Plan
Test Item Tree
Risk Strategy
Risk Identification
Risk Assessment
Testing, Inspection etc.
Matrix: Cost and Probability
Risk Mitigation
Risk Reporting
Test Metrics
Risk Prediction
Figure 1: Risk analysis activity model. This model is taken from Karolak’s book “Software Engineering Risk Management”, 1996 [6] with some additions made (the oval boxes) to show how this activity model fits in with the test process.
Risk Identification
The activity of identifying risk answers these questions:
Is there risk to this function or activity?
How can it be classified?
Risk identification involves collecting information about the project and classifying it to determine the amount of potential risk in the test phase and in production (in the future).
The risk could be related to system complexity (i.e. embedded systems or distributed systems), new technology or methodology involved that could cause problems, limited business knowledge or poor design and code quality.
Risk Strategy
Risk based strategizing and planning involves the identification and assessment of risks and the development of contingency plans for possible alternative project activity or the mitigation of all risks. These plans are then used to direct the management of risks during the software testing activities. It is therefore possible to define an appropriate level of testing per function based on the risk assessment of the function. This approach also allows for additional testing to be defined for functions that are critical or are identified as high risk as a result of testing (due to poor design, quality, documentation, etc.).
Risk Assessment
Assessing risks means determining the effects (including costs) of potential risks. Risk assessments involves asking questions such as: Is this a risk or not? How serious is the risk? What are the consequences? What is the likelihood of this risk happening? Decisions are made based on the risk being assessed. The decision(s) may be to mitigate, manage or ignore.
The important things to identify (and quantify) are:
What indicators can be used to predict the probability of a failure?
The important thing is to identify what is important to the quality of this function. This may include design quality (e.g. how many change requests had to be raised), program size, complexity, programmers skills etc.
What are the consequences if this particular function fails?
Very often is it impossible to quantify this accurately, but the use of low-medium-high (1-2-3) may be good enough to rank the individual functions.
By combining the consequence and the probability (from risk identification above) it should now be possible to rank the individual functions of a system. The ranking could be done based on “experience” or by empirical calculations. Examples of both are shown in the case study later in this paper.
Risk Mitigation
The activity of mitigating and avoiding risks is based on information gained from the previous activities of identifying, planning, and assessing risks. Risk mitigation/avoidance activities avoid risks or minimise their impact.
The idea is to use inspection and/or focus testing on the critical functions to minimise the impact a failure in this function will have in production.
Risk Reporting
Risk reporting is based on information obtained from the previous topics (those of identifying, planning, assessing, and mitigating risks).
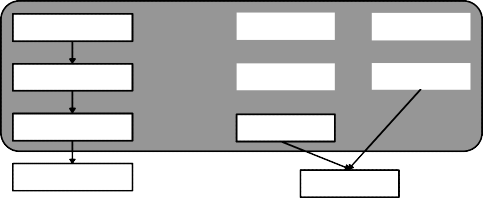
Risk reporting is very often done in a standard graph like the following:
High
1
Probability
2
3
4
Low
Low
Consequence
High
Figure 2: Standard risk reporting - concentrate on those in the upper right corner!
In the test phase it is important to monitor the number of errors found, number of errors per function, classification of errors, number of hours testing per error, number of hours in fixing per errors etc. The test metrics are discussed in detail in the case study later in this paper.
Risk Prediction
Risk prediction is derived form the previous activities of identifying, planning, assessing, mitigating, and reporting risks. Risk prediction involves forecasting risks using the history and knowledge of previously identified risks.
During test execution it is important to monitor the quality of each individual function (number of errors found), and to add additional testing or even reject the function and send it back to development if the quality is unacceptable. This is an ongoing activity throughout the test phase.
Metrics
This chapter will give a very brief introduction to metrics used in this document. There are several reasons to use metrics, for instance:
Return on investment (cost / benefit analyses)
Evaluate choices, compare alternatives, monitor improvement
Have early warning of problems, make predictions
Benchmark against a standard or in competition
This chapter will not give a complete picture of use of metrics. For those of you interested in reading more about metrics Norman E. Fenton & Shari Lawrence Pfleeger, 1997 [8] is recommended as a good source of information.
In this document we will make the distinction between metrics used for measuring progress and metrics used for the prediction and probability of faults.
Metrics for Progress Tracking
Metrics used for measuring progress:
the number of tests planned, executed and completed
the number of faults per function
the number of hours used in testing per fault found
the number of hours used in fixing per fault (to correct the error and return the function to re-test)
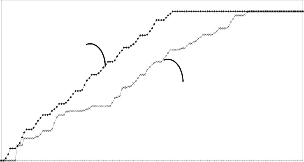
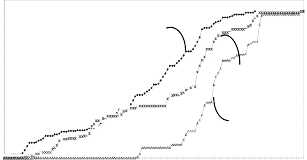
The metrics were reported graphically and trend analysis applied. For instance the information about "test planned, executed and planned" was compared with information about "faults to be fixed and actually fixed". The reason was to have an early warning of a resource problem if the number of not completed tests increased at the same time as the number of faults to be fixed were increasing.
Based on the information above, it was possible to calculate "Estimated to Complete" in number of hours, i.e. resource requirements to complete the test project. This was of course very important information in a project based on reducing risk and dynamic resource allocation to the most critical areas.
Metrics to predict probability of faults
A completely different type of metric is used to identify probability of faults in the system. Identifying indicators that were expected to be of importance per function did this. Indicators could be "Changed functionality since previous release", size of function (i.e. number of lines of code), complexity (this could be functional complexity or structural complexity), quality of design documentation etc. A number of 1, 2 or 3 (i.e. low, medium or high) was given to each indicator per function as well as a weight to handle different importance between the indicators.
Now a probability of having a fault could be calculated per function and compared to the other functions in that system. This information should then be combined with information about the consequence of a fault in each function.
Based on this information it will now be possible to "rank" the list of functions based on risk exposure (probability and cost of a fault).
The Case
The rest of this paper will discuss a case study using the risk based approach to software testing, relating the different activities to the activity model discussed in the previous chapter.
The Application
This paper is based on the system test stage of a project developing a retail banking application. The project included an upgrade of a Customer Information System being used by clients as a central customer, account and product database, and a complete reengineering of a Deposit Management System. The project scope included reengineering of the data model, technology change from IMS/DL1 to CICS/DB2, rewrite from JSP COBOL to COBOL-2 and a completely new physical design. During this rewrite large investments were done in productivity tools, design, quality assurance and testing.
The project started in June 1994 and was delivered in October 1995. The project total was approximately 40 man years over 17 months. This paper documents experiences from the system test stage, which consumed approximately 22% of the total project resources.
The applications consist of approximately 300 on-line transactions and 300 batch programs, a total of 730,000 SLOC1 and 187 dB2 tables. This is the server part only, no client-GUI was tested in this project.
The Scope
The system test stage included:
Technical System Test, i.e. what is usually referred to as environment test and integration test. Due to differences between the development environment and the production environment, the system test stage had to test all programs in the production environment. During system test the test team had to do the integration test of the on-line system by testing and documenting all on-line interfaces (called modules). The team also had to perform the integration test of the batch system(s) by testing and documenting that all modules had been called and also testing the complete batch flow.
Functional System Test, i.e. black box testing of all programs and modules to detect any discrepancies between the behaviour of the system and its specifications. The integration test verified that all modules had been called, and that the functional system test was designed based on application functionality.
Non-functional System Test. The system test also tested the non-functional requirements, i.e. security, performance (volume- and stress-test), configuration (application consistency), backup and recovery procedures and documentation (system, operation and installation documentation).
As for all projects, the time and resources were limited. At the beginning of construction (programming), the system test strategy was still not agreed upon. Since the development project was a very large project to the vendor and therefore consumed nearly all available resources, the number of people with experience available for test planning was limited.
The final system test strategy for the system test was agreed approximately one month before end of construction, and the time for planning was extremely short. A traditional approach to system test planning based on test preparation done in parallel with design and construction, could therefore not be used.
The following project stages were executed before the system test2:
Project Initiation - PI (organising the project, staffing and development environment)
Requirement Analysis - RA (documents the functional requirements to the application)
Logical Design - LD (data model and process model)
Physical Design - PD (program design - executed as part of construction)
Construction and Unit Test - CUT (programming and testing, including a 100% code coverage test)
The Challenge
Why did the vendor need a Risk Based Approach to the System Test?
Because:
The Available Calendar Time was limited. The development project had a very short time frame. The construction and unit test stage was also delayed, so the time available for system test had to become even shorter! The applications are very flexible, and therefore very complicated to test. The calendar time did not allow for a thorough testing of all functions. Focus had to be put on those areas representing the largest risk if a fault occurred. The vendor needed a methodology to identify the most critical areas to test.
There were limited available resources before the end of construction! Midway through construction a limited number of senior analysts were available for system test preparation, one for on-line and one for batch, in addition to management. The estimates to build all identified test scripts were 8 - 10 people in each of the teams (on-line and batch) until system test start! A test methodology had to be developed based on limited resources during test preparation and using most resources during test execution.
There were several risk factors. Due to strict quality control of the unit test (including 100% code coverage requirements), the modules were expected to be of good quality when entering system test. However, a lot of other factors indicated trouble:

1 SLOC = Source Line of Code, excluding comments
2 The methodology was based on LBMS’ Systems Engineering, see Systems Engineering [4].
The project utilised a new development environment for programming, debugging and unit test based on Microfocus COBOL Workbench on PC, running CICS with OS/2. The exact effect of the learning curve on the programmer’s productivity by starting with a tool all new to the organisation, was unknown.
The development environment for on-line proved to be fairly good. However, the JCL-support for large batch streams was poor. Therefore, batch integration tests between units were not extensive and represented a risk to the integration test part of the system test.
The system test was exclusively executed on the IBM mainframe after the source code was transferred. A test bench was developed on the IBM mainframe, executing transactions as a “dumb-terminal” client. This represented a risk since The vendor did not have any experience of the difference between the PC development environment and the mainframe environment. Differences in SQL-implementation were discovered during the project.
Because of the vendor’s expansion, a lot of the programmers were new to the company and though well educated, most of them were new to the application area and to the technology being used.
The number of people involved was high (approximately 50 at peak) and the development time was short (planned to 17 months), this was one of the largest projects done by the vendor ever. Even though the vendor has been conducting large projects in the past, available experience from projects with this size in a compressed time frame, was limited.
What did the vendor do?
The System Test Strategy document had to be rewritten. The customer did receive the preliminary version of the strategy explaining a “traditional well documented test” with everything documented prior to test execution. We had to convince the customer that this new approach was “as good as the original one, except that the new one was feasible, given the calendar time and resources available”. The System Test Strategy would define the “minimum level of testing” including level of documentation for all functions and identify how a Risk Analysis would be used to identify functions to be focused on during test execution.
We had to perform a Risk Analysis to identify the most critical areas both to the customer and to the vendor. A methodology had to be identified and implemented.
The System Test Process and Organisation had to be improved, and even “optimised”. This included defining the test process by preparing procedures, planning the test, controlling the process, progress tracking, and defining roles and responsibilities. The vendor had to convince the customer about the feasibility of the new strategy and prove the quality of the process and the product to be delivered. To document the test progress and to communicate this to the customer, became a key issue.
Automated Testing was part of the contract. Initially we intended to use automated testing for all on-line functions. As the resources and time became very limited, automated testing became part of the risk based strategy, i.e. it was used to handle those on-line transactions with most faults.
The rest of this paper will document the implementation of the risk based strategy by the vendor, showing required changes to the system test process and the organisation.
The Strategy
The project started with a Traditional Approach to testing, i.e. the test should be prepared with input and output as part of the design and construction stages, prior to system test start. However, it was obvious as time passed by and only limited resources were available to prepare the System Test, that this strategy was impossible to fulfil.
The original system test strategy document (based on a traditional test approach), identified the following test structure for both on-line and batch testing:
System Test Plan, documenting the test scope, environment and deliverables, test control procedures, test tools to be used, test schedule and phases, and listing start and stop criteria related to each phase.
Test Specification, i.e. a detailed break down of the application into testable units.
Test Cases, i.e. documentation of what to test, basically listing all requirements enabling a tester to easily read them.
Test Scripts, i.e. documentation of how to test “step by step”, including test data to be used by the tester.
Implementing a structure like the one above is very time consuming, especially step 4 - documenting test scripts.
Midway through construction it became obvious that it was impossible to document everything before end of construction. Either the project would be delayed, or the test planning process had to be changed.
The main problem at this stage was the preliminary system test strategy document delivered to the customer. How do you have the customer accept that you will not be able to document all tests prior to test execution as thoroughly as you originally intended to? By convincing him that the new process will improve the product quality!
The key words became “Risk Based Approach” to testing. We agreed with the customer (reference to the risk activity model in chapter 2 is given in italic):
The vendor will test all functionality in the application to “a minimum level” (in addition to all interfaces, and all non-functional tests). This will not be documented prior to the test, but logging of details for all tests (i.e. input, expected output and actual output), will after test execution, prove this “minimum level of testing” (Risk Strategy).
All test cases (“what to test”) will be documented prior to test start and will be available for the customer to review (Risk Strategy).
Only highly qualified testers, i.e. system analysts experienced in the application area, were to be utilised for testing, and the testers will be responsible for planning all “test shots”, including providing test data and documenting the executed tests. (Tools were available to the tester for documenting the tests) (Risk Strategy).
The vendor will do a risk analysis together with the customer to identify those areas of highest risk, either to the customer or to the vendor (Risk Identification and Risk Assessment).
Based on the Risk Analysis, the vendor will focus “extra testing” in those areas of highest risk (Risk Mitigation).
“Extra testing” will be planned and performed by a specialist in the application area, that are not involved in the “minimum level of testing” (Risk Mitigation and Risk Reporting).
The 6 bullet points above cover all activities from Risk Identification through Risk Reporting. How risk reporting was used as input to risk prediction is explained later.
The customer approved the idea, and the vendor was ready to start. The project was now in a hurry and had to do the following:
Complete the documentation of all test cases (what to test) for on-line and batch
Perform the Risk Analysis for on-line and batch and plan any “extra testing”.
Document the new risk based test process, including procedures, check lists, training the testers and preparing the test organisation.